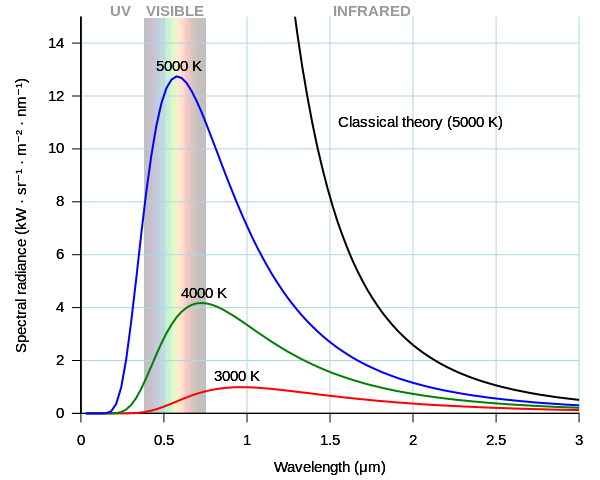
File:Black body.svg
外观

此SVG文件的PNG预览的大小:600 × 480像素。 其他分辨率:300 × 240像素 | 960 × 768像素 | 1,280 × 1,024像素 | 2,560 × 2,048像素。
原始文件 (SVG文件,尺寸为600 × 480像素,文件大小:20 KB)
文件历史
点击某个日期/时间查看对应时刻的文件。
| 日期/时间 | 缩略图 | 大小 | 用户 | 备注 | |
|---|---|---|---|---|---|
| 当前 | 2024年1月3日 (三) 03:48 |  | 600 × 480(20 KB) | Glrx | remove #text nodes after tspan elements // Editing SVG source code using c:User:Rillke/SVGedit.js |
| 2023年9月30日 (六) 11:08 |  | 600 × 480(20 KB) | Townie | File uploaded using svgtranslate tool (https://svgtranslate.toolforge.org/). Added translation for ca. | |
| 2020年4月7日 (二) 11:28 |  | 600 × 480(15 KB) | GKFX | cleanup, move curves to foreground | |
| 2020年3月6日 (五) 14:21 |  | 600 × 480(33 KB) | Oz1sej | File uploaded using svgtranslate tool (https://tools.wmflabs.org/svgtranslate/). Added translation for da. | |
| 2020年3月6日 (五) 14:19 |  | 600 × 480(33 KB) | Oz1sej | File uploaded using svgtranslate tool (https://tools.wmflabs.org/svgtranslate/). Added translation for da. | |
| 2013年7月10日 (三) 17:06 |  | 600 × 480(30 KB) | Cmglee | Add visible spectrum. | |
| 2013年2月11日 (一) 00:18 |  | 600 × 480(26 KB) | Vaughan Pratt | "Spectral radiance" more standard than "Intensity" in ylabel; replaced "arb units" by actual units (kW per sq m per steradian per nm) | |
| 2010年9月18日 (六) 10:40 |  | 600 × 480(25 KB) | UncleDouggie | Restore the μ symbol in the axis label that I lost when generating the recent update. | |
| 2010年9月18日 (六) 10:03 |  | 600 × 480(25 KB) | UncleDouggie | Added grid lines to match original PNG file, changed color of classical plot to black as required by existing text in some articles that use the PNG version. | |
| 2010年6月5日 (六) 15:58 |  | 600 × 480(11 KB) | Darth Kule | fix mistake |
文件用途
全域文件用途
以下其他wiki使用此文件:
- af.wikipedia.org上的用途
- ar.wikipedia.org上的用途
- arz.wikipedia.org上的用途
- as.wikipedia.org上的用途
- beta.wikiversity.org上的用途
- bn.wikipedia.org上的用途
- bs.wikipedia.org上的用途
- ca.wikipedia.org上的用途
- ckb.wikipedia.org上的用途
- cs.wikipedia.org上的用途
- da.wikipedia.org上的用途
- en.wikipedia.org上的用途
- Black body
- Planck's law
- Ultraviolet catastrophe
- Astronomical spectroscopy
- Black-body radiation
- Modern physics
- Portal:Physics
- Introduction to quantum mechanics
- Talk:Extinction (astronomy)
- History of quantum mechanics
- Planck constant
- Wikipedia:Reference desk/Archives/Science/2011 November 12
- Wikipedia:Reference desk/Archives/Science/2023 July 20
- Wikipedia:Reference desk/Archives/Science/2023 October 3
- en.wikibooks.org上的用途
- en.wikiquote.org上的用途
- en.wikiversity.org上的用途
- User:Marshallsumter/Radiation astronomy/Cyans
- User:Marshallsumter/Radiation astronomy1/Mathematics
- Draft:Original research/Radiation physics
- Problems/Astronomy
- Planck's equation
- Talk:WikiJournal of Science/Submissions/Introduction to quantum mechanics
- Radiation/Electromagnetics
- User:Marshallsumter/Radiation astronomy/Electromagnetics
- Portal:Radiation astronomy/Problems
- Portal:Radiation astronomy/Problems/6
- User:Marshallsumter/Radiation astronomy/Blacks
- eo.wikipedia.org上的用途
查看此文件的更多全域用途。


